Case 02 · Data products · Design systems

Five analytics products, one platform.

After an acquisition and rebrand, NielsenIQ’s analytics products had grown apart while teams kept shipping. I treated navigation and the object model as shared infrastructure and gave dense analysis one path: orient, compare, explain.

CompanyNielsenIQ
RoleDirector of UX
Team6 design leaders and senior designers
Scope5 enterprise analytics platforms
TimelineMay 2020 – Jun 2024
Problem

Five independently grown platforms, inherited patterns and dense data workflows, all under active delivery pressure for a Fortune 500 client base.

Decision

Unify the structure, not just the look: shared information architecture, object model and navigation logic, plus one analysis pattern.

Result

One connected ecosystem with a durable product-level rebrand and standards teams could apply without escalating every decision.

The rebrand was the trigger. Structure was the problem.

NielsenIQ ran a global analytics ecosystem with many surfaces, inherited patterns and dense decision-support workflows. A new visual identity alone would have left five products that still worked differently.

The work had to create standards teams could use while they kept shipping complex client-facing software.

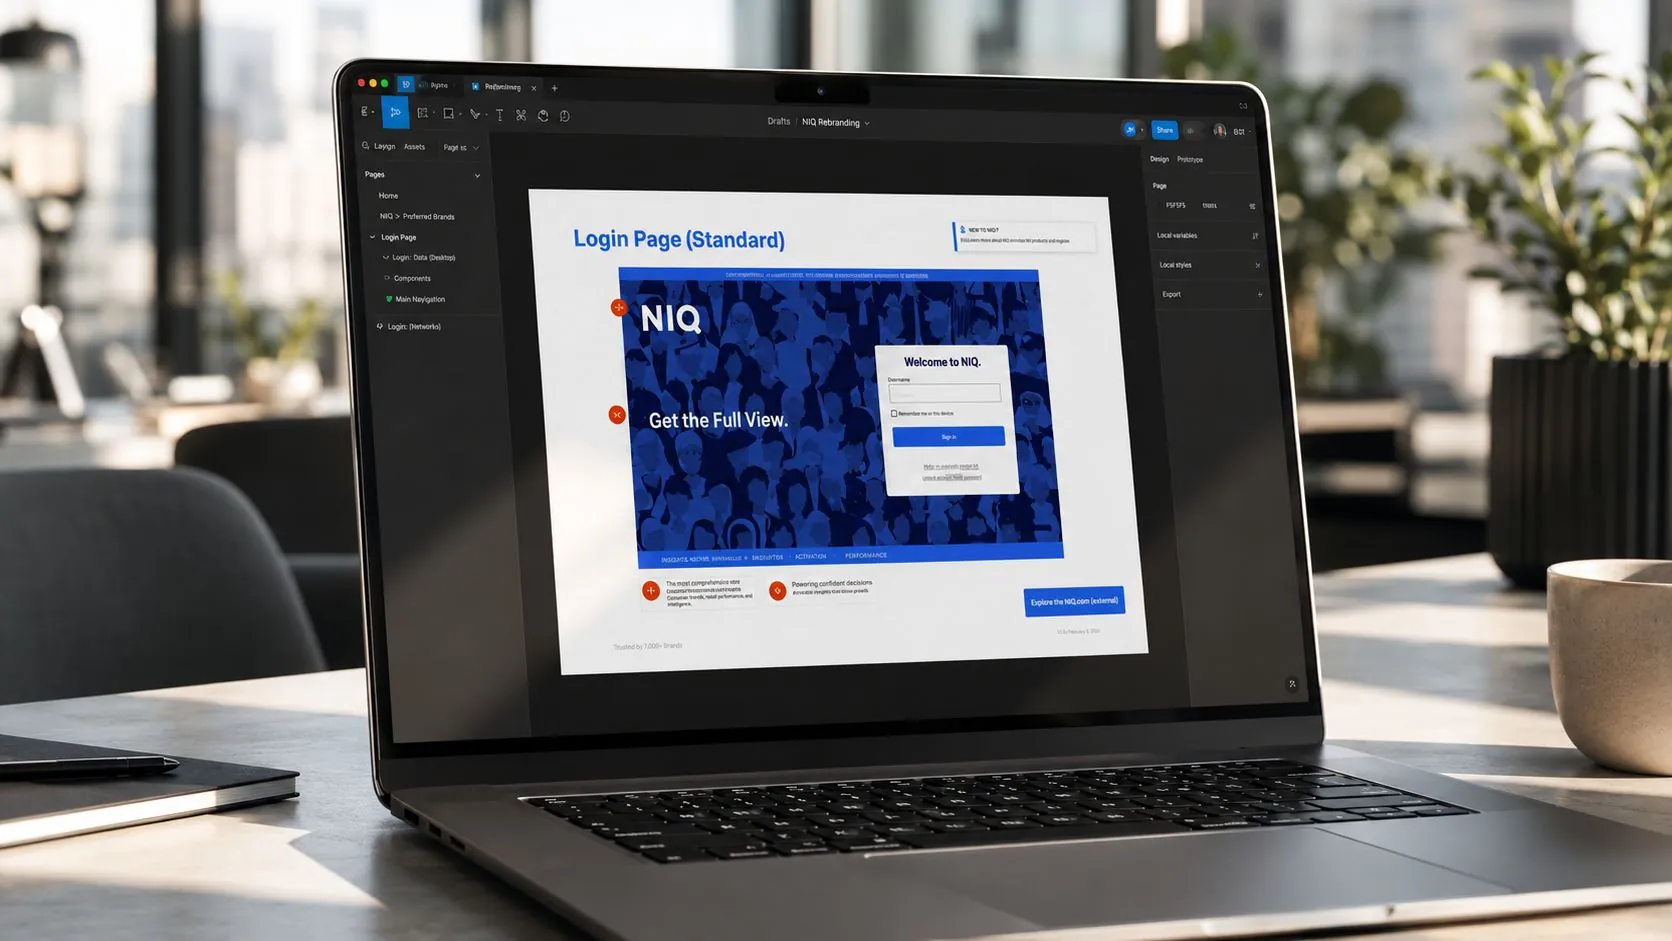
NIQ rebrand applied to an analytics product on a laptop
The rebrand became a platform-design opportunity: identity translated into product rules, workflow patterns and reusable interface standards.
Product identity

One recognizable product family

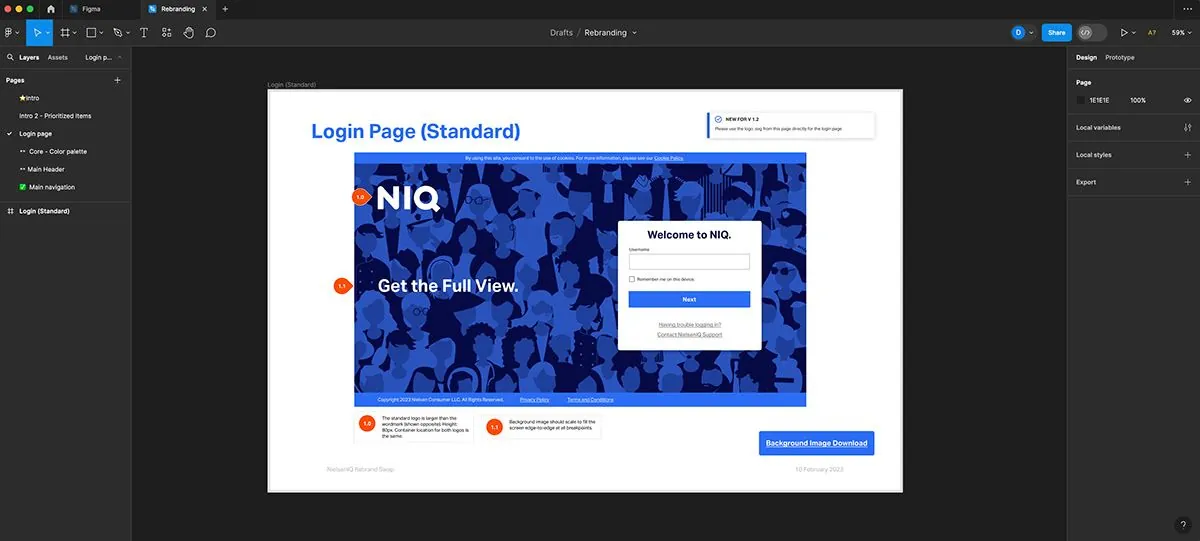
The new brand carried into interface surfaces, login, navigation, hierarchy and reusable product expression.

Navigation

One way to move between products

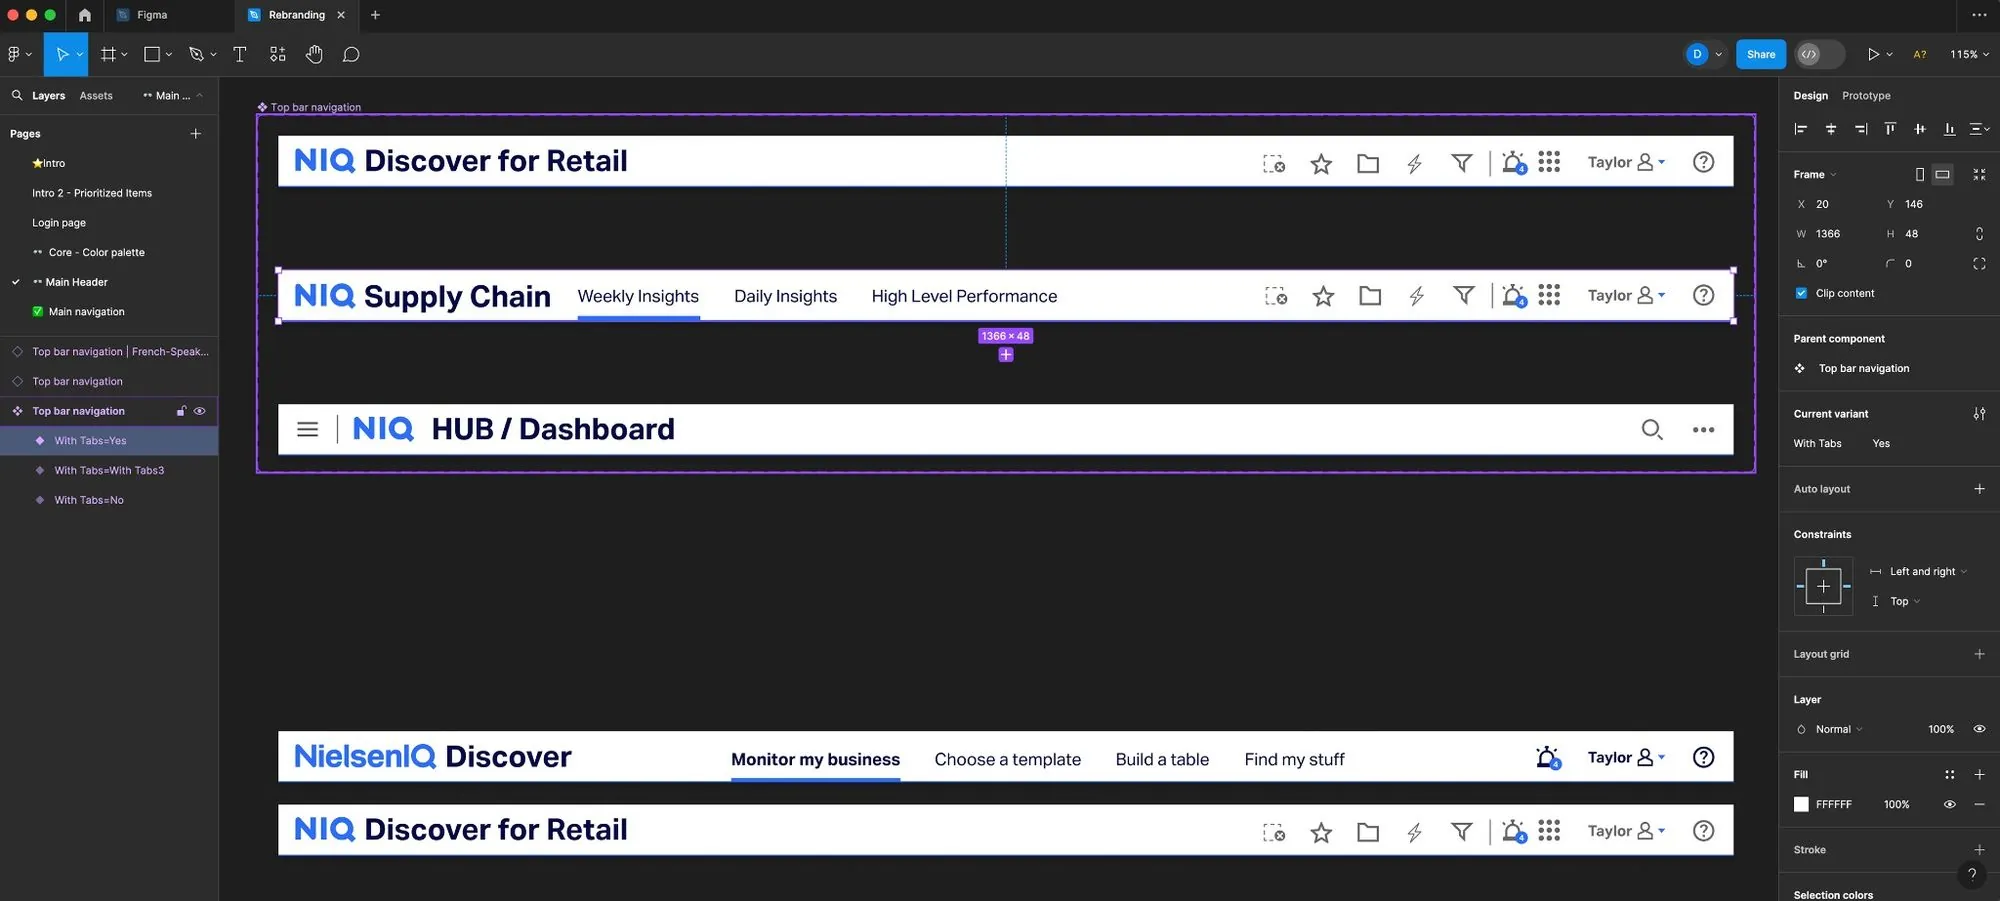
A model that flexes across Discover for Retail, Supply Chain, Hub, dashboards and product-family contexts.

Analytics workflows

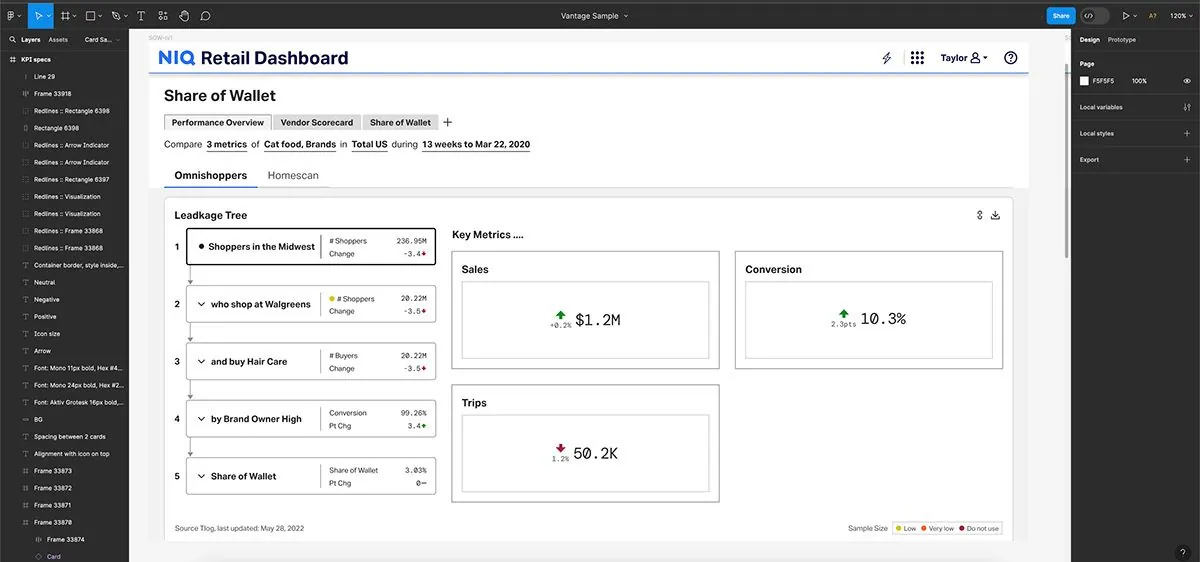
Dense data that reads clearly

Decision-support views that are easier to scan, compare, configure and explain.

My role

I joined NielsenIQ through its acquisition of Precima and led UX direction across the platform.

Platform convergence

Five platforms into one ecosystem

Converged five independently grown analytics platforms through a shared information architecture, object model and navigation logic.

Integration

Post-acquisition product integration

Directed the integration of multiple products into a unified B2B analytics platform.

Design-system governance

Standards with a contribution model

Governed design-system standards: a contribution model, a maintenance roadmap and documented decisions.

Technical partnership

UX through a platform transition

UX partner through a move to microservices and API-driven data flows, working with Product, Engineering, Brand and UX.

Four decisions that shaped the work

Each one favored structure teams could reuse over a faster, surface-level fix.

1

Treat navigation as infrastructure

A shared top-level structure for moving across product families, modules and dashboards, built on one object model.

Why: at platform scale, navigation is the connective tissue. Products can feel connected without forcing every surface into the same template.

2

Give analysis one path: orient, compare, explain

Every dense view follows the same sequence: set scope, compare segments, then explain what drove the change.

Why: the products had depth but did not help users know where to look. A shared sequence keeps the depth and adds a route through it.

3

Design for explanation, not display

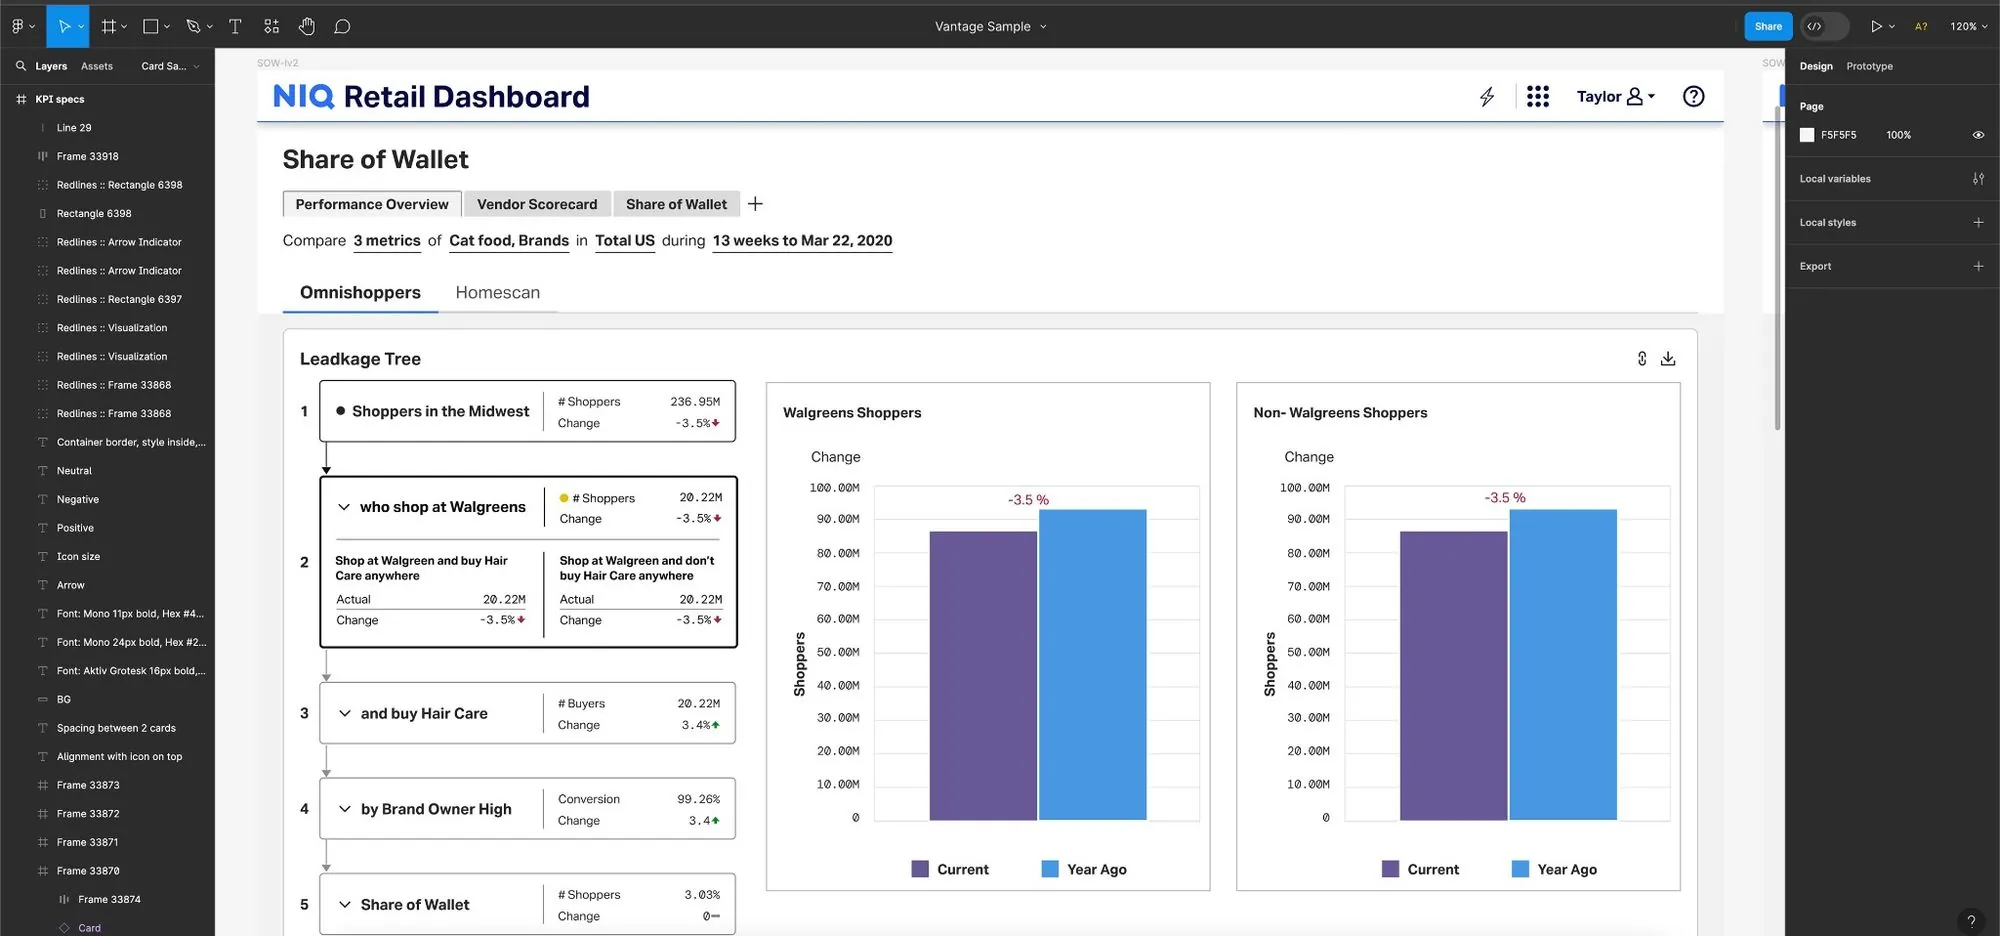
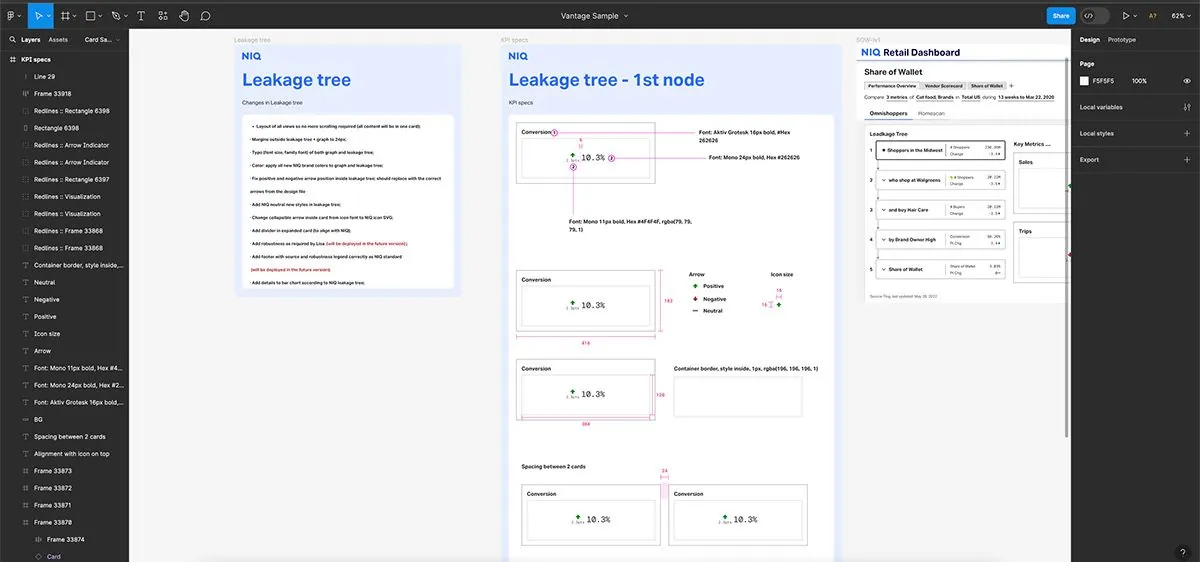
The leakage tree broke analysis into nodes, states and configuration choices, a repeatable way from question to cause.

Why: showing a result without its path leaves users guessing. A node model can be reviewed, built and reused across products.

4

Govern beyond components

Standards covered navigation, hierarchy, data-visualization rules and documented decisions, with a contribution model.

Why: teams under delivery pressure need to make good calls without escalating every detail. Documented decisions make that possible.

The work

From the platform frame down to the analysis views. Select any image to expand it.

A shared frame for every product

Navigation explorations set one top-level structure across Discover for Retail, Supply Chain, Hub and related products. Entry and login became system surfaces too.

Orient, compare, explain

The sequence behind every analysis view.

01

Orient

A clear starting point: scope, filters, timeframe, comparison basis and business context.

02

Compare

Side by side across banners, households, segments, product groups and measures.

03

Explain

From a metric shift to the drivers and evidence behind it.

From dense data to readable analysis

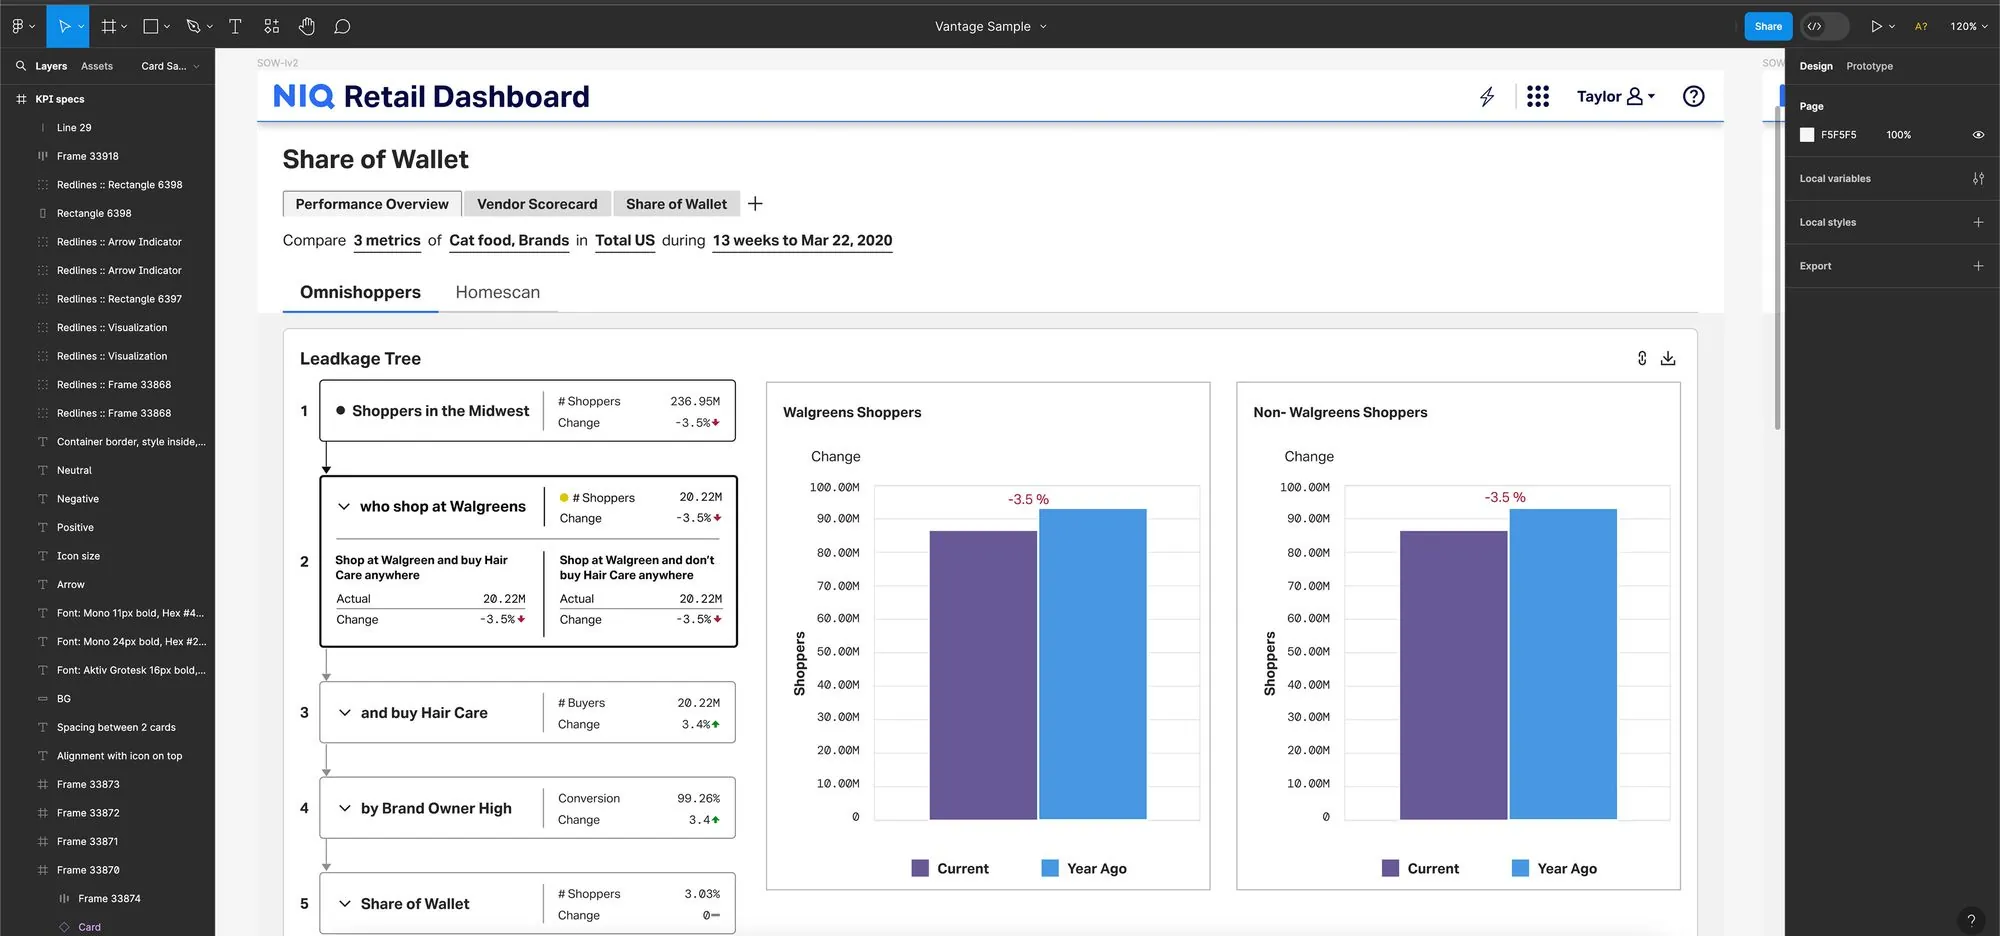
Share-of-wallet views show the platform problem clearly: large analytical payloads that needed hierarchy and a deliberate visual language.

Explanation as a pattern

The leakage tree modelled how users move from a broad business question into a structured diagnostic path.

Governance teams could use

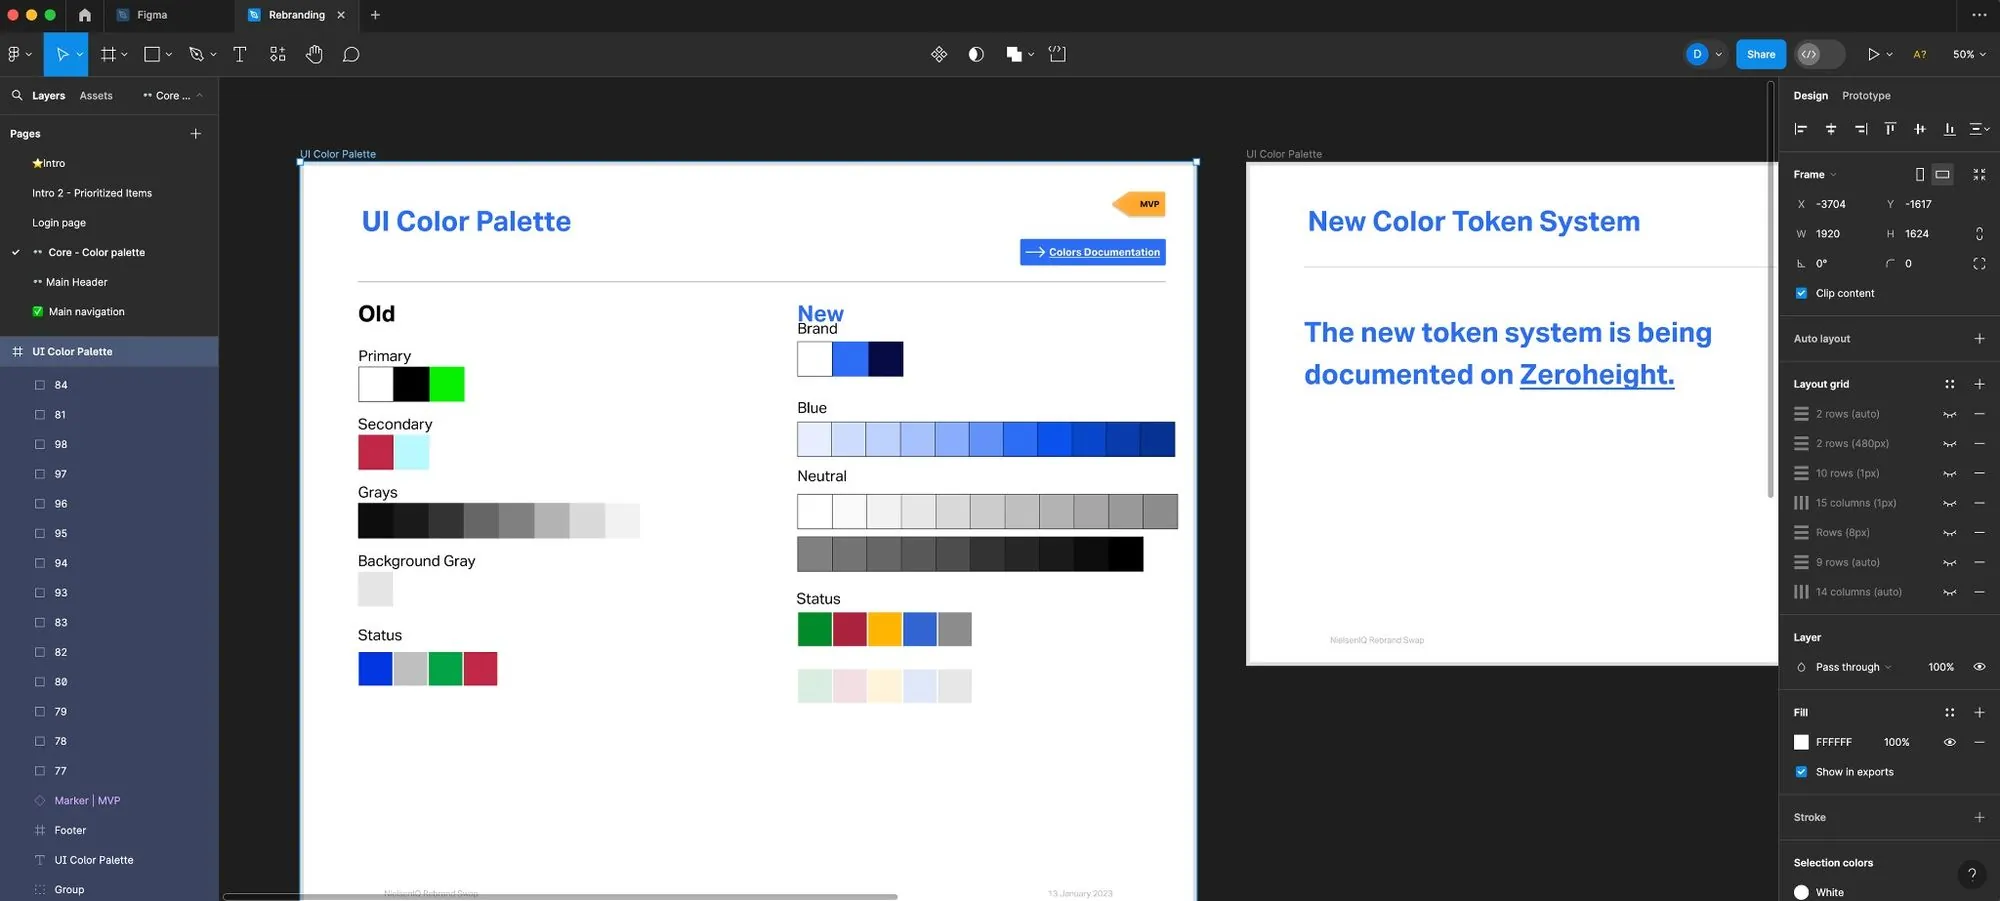
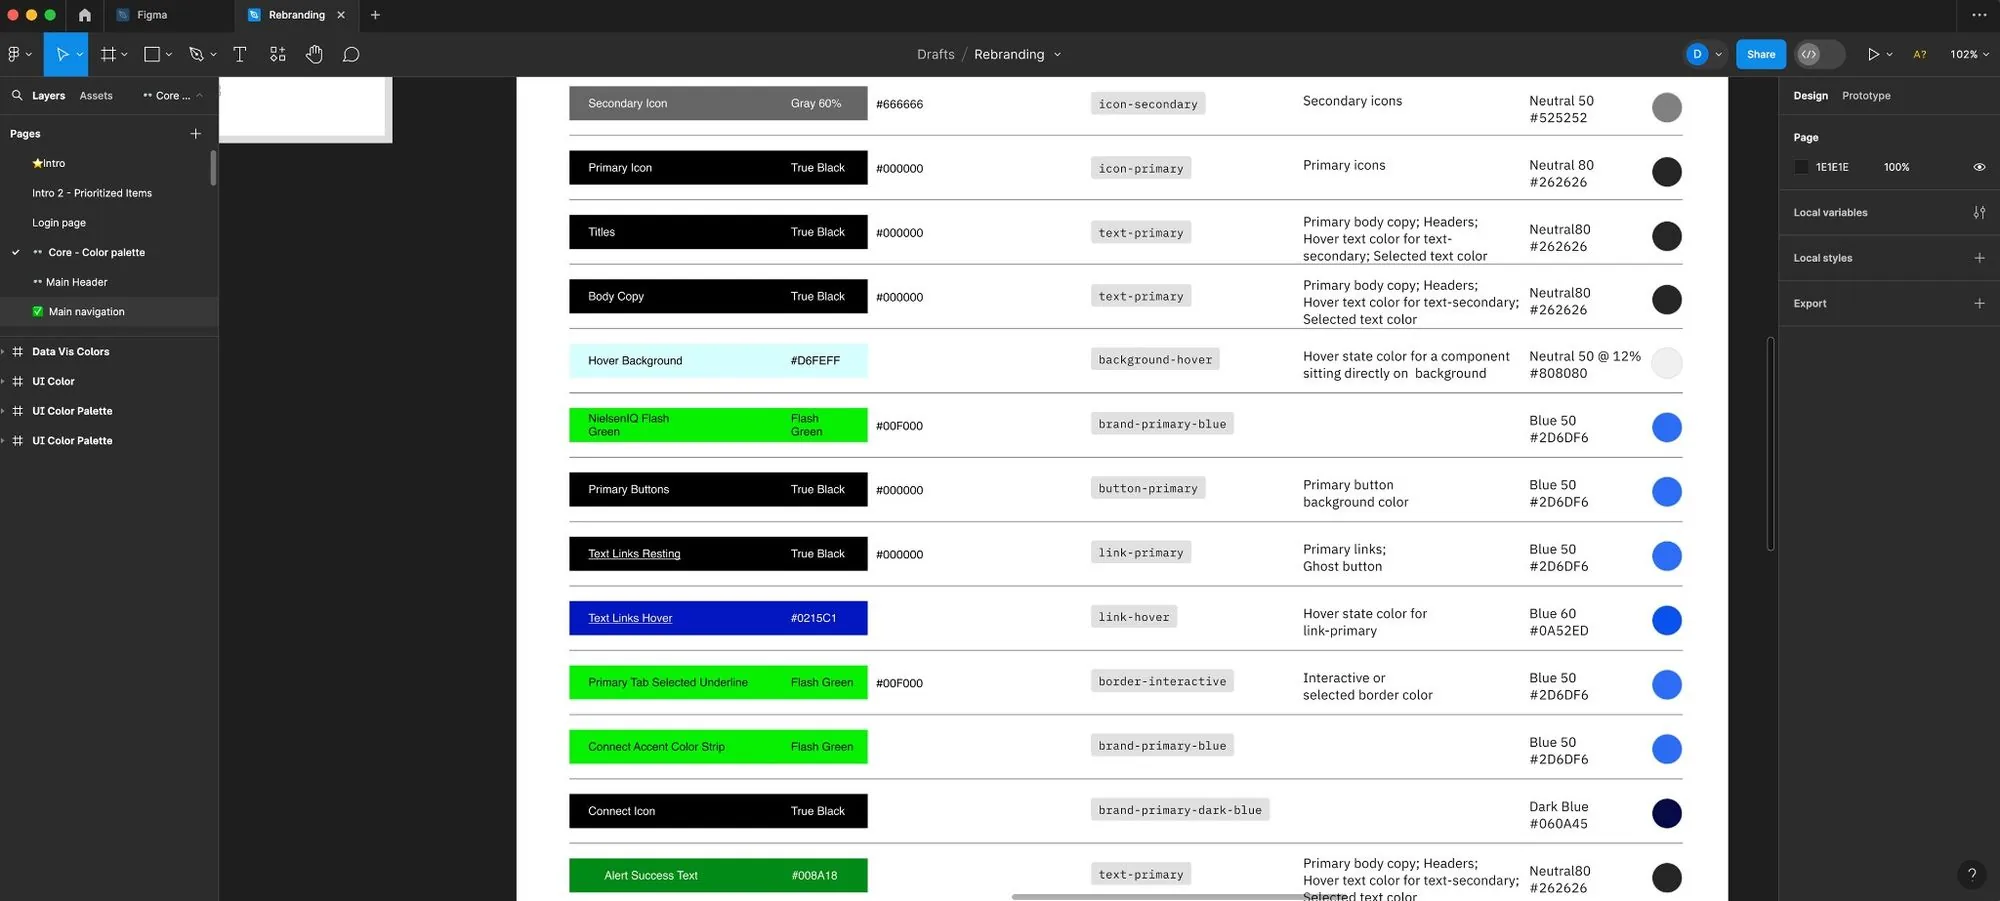
The rebrand palette became a token system with named roles and values, documented where every team could find it.

Outcome

The rebrand became durable at the product level. Cross-product navigation got clearer, analysis followed one pattern, and teams had a stronger foundation for consistent delivery.

Platform

What changed in the product

  • Five independently grown platforms converged into one ecosystem.
  • More coherent entry, navigation, dashboards and analysis workflows.
  • A move from fragmented inherited surfaces toward one platform experience.
Leadership

What changed in how teams worked

  • Led design through acquisition, rebrand and platform-scale complexity.
  • Moved teams from one-off screen decisions to reusable patterns and standards.
  • Raised critique from visual polish to workflow clarity, consistency and trust.
ConfidentialitySome detail is left out of this page. I can walk through the decisions in more depth in conversation.
ContinuityI joined NielsenIQ through its acquisition of Precima. That earlier work is the next case.

“A rebrand lasts when it becomes a product system teams can use.”