Confidence per row, not per answer
Each result row carries its own confidence and reason.
Why: one overall score hides the weak row. Analysts act row by row, so trust has to be readable row by row.
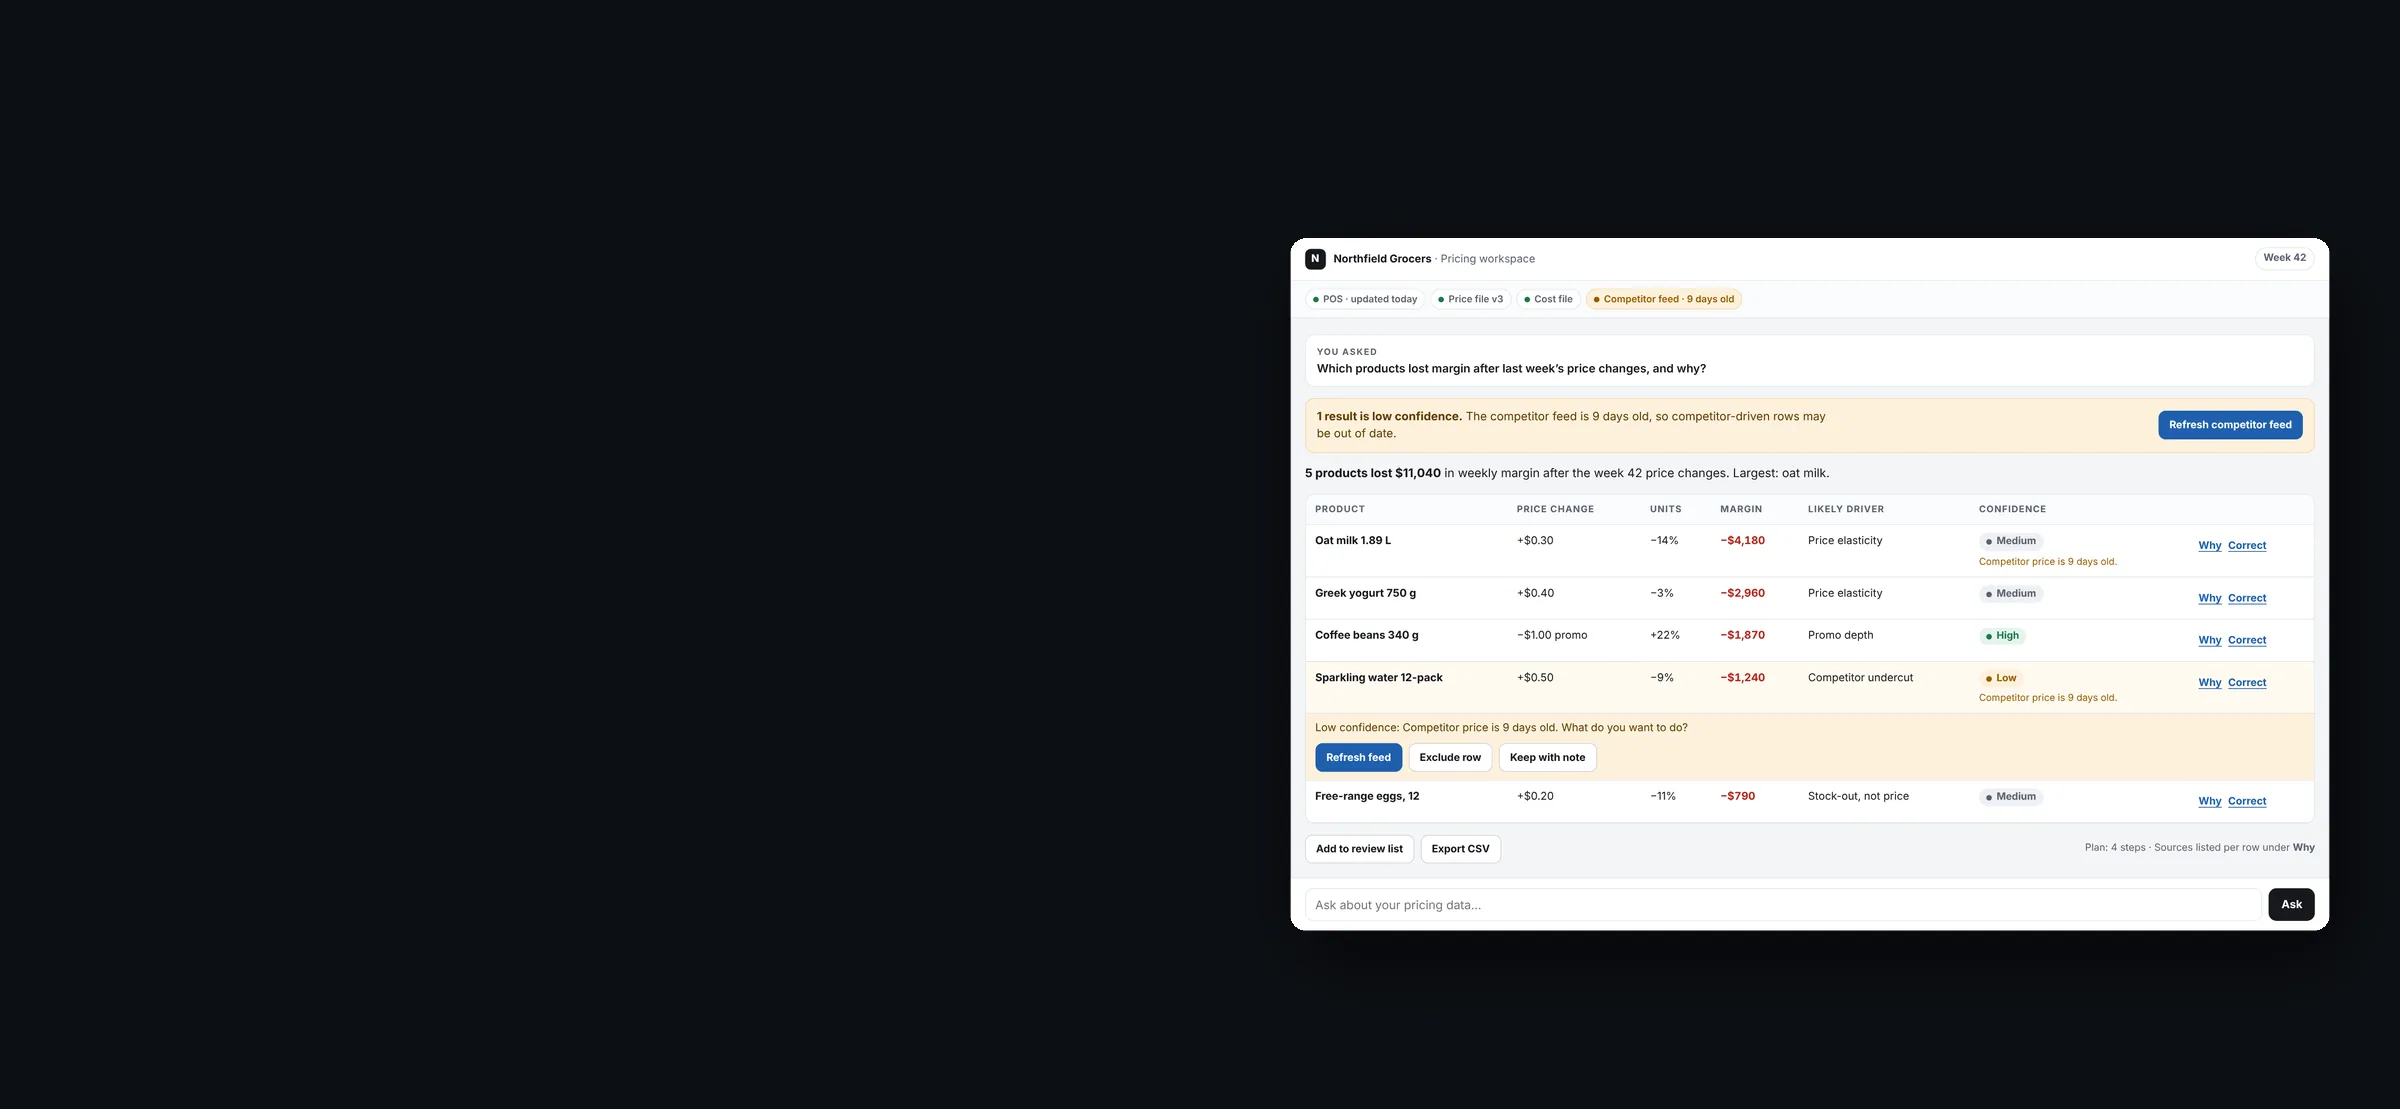
A working concept for a retail pricing team: every state an AI feature needs inside an analytics product, from the first task to a recorded correction. Built in October 2026 with invented data. Try it below.
Most AI features are designed for the happy path. Analysts need to know when to trust a result, what happens when data fails, and how their corrections are kept.
Design all six states first. Make the plan, per-row confidence, sources and corrections part of the output, not hidden behind a chat reply.
A clickable prototype you can run below: start a task, watch the plan, inspect a weak result, recover from a failure and correct the assistant.
Start the first task, or jump to any state. In the result, open Why on a row, or choose Correct to change a driver and give a reason.
Everything runs in your browser. The data is invented; every question runs the same analysis.
The states AI-role job descriptions ask for. Each has a rule the interface has to keep.
Starter tasks come from the user’s own workspace, with the data the assistant can see listed up front.
Each step is visible with its data source. Stopping keeps what is already done.
A table, not a paragraph. Every row has a confidence level, its sources and a plain reason.
Weak rows are marked with the cause and three choices: refresh the data, exclude the row, or keep it with a note.
Say what failed in plain words, keep completed steps, and offer a retry or a path without the missing source.
The user’s change and reason are kept in an audit trail, with a clear scope for where it applies.
Each one trades a simpler interface for something a pricing analyst needs before acting on a number.
Each result row carries its own confidence and reason.
Why: one overall score hides the weak row. Analysts act row by row, so trust has to be readable row by row.
The steps and their data sources stay visible during and after the run.
Why: when a number looks wrong, the first question is which data it came from. The plan answers that without a support ticket.
A failed source ends one step, not the whole analysis.
Why: restarting a long run because one feed timed out teaches people to stop using the feature.
Changing a driver asks why, and says where the change applies.
Why: an unexplained edit can’t be reviewed or learned from. A reason turns a fix into shared knowledge.
What I chose, what I didn’t, and why. Kept as the work went.
Chosen over maintenance triage and a design-system checker. It is the domain of my Precima and NielsenIQ work, and margin questions make confidence and sources matter.
A one-line summary sits above the table, but the table is the answer. Considered a chat reply with an attached table; rejected because it reads as final.
High, medium, low, each with the reason. Considered percentages; rejected because 73% invites false precision and says nothing about what to do.
Old competitor prices lower confidence on the affected rows. A feed that does not answer stops that step and says so.
A correction applies to this team’s workspace and is visible in the audit trail. Considered silent model updates; rejected because nobody could review them.
Plain HTML, CSS and JavaScript. No framework, no back end. The source is public on GitHub under an MIT license.
I defined the states, the decisions and the interaction rules, and directed the build. An AI coding assistant (Claude) wrote most of the code to that spec.
Northfield Grocers, its products and every number are fictional. No client data and no former employer’s work is used here.
Not yet tested with users. Next: five short sessions with pricing analysts, focused on whether row confidence changes what they act on.
The IBM case shows the verified-output patterns I led in production. This concept adds the states that case does not show: uncertainty, failure and correction.